View:
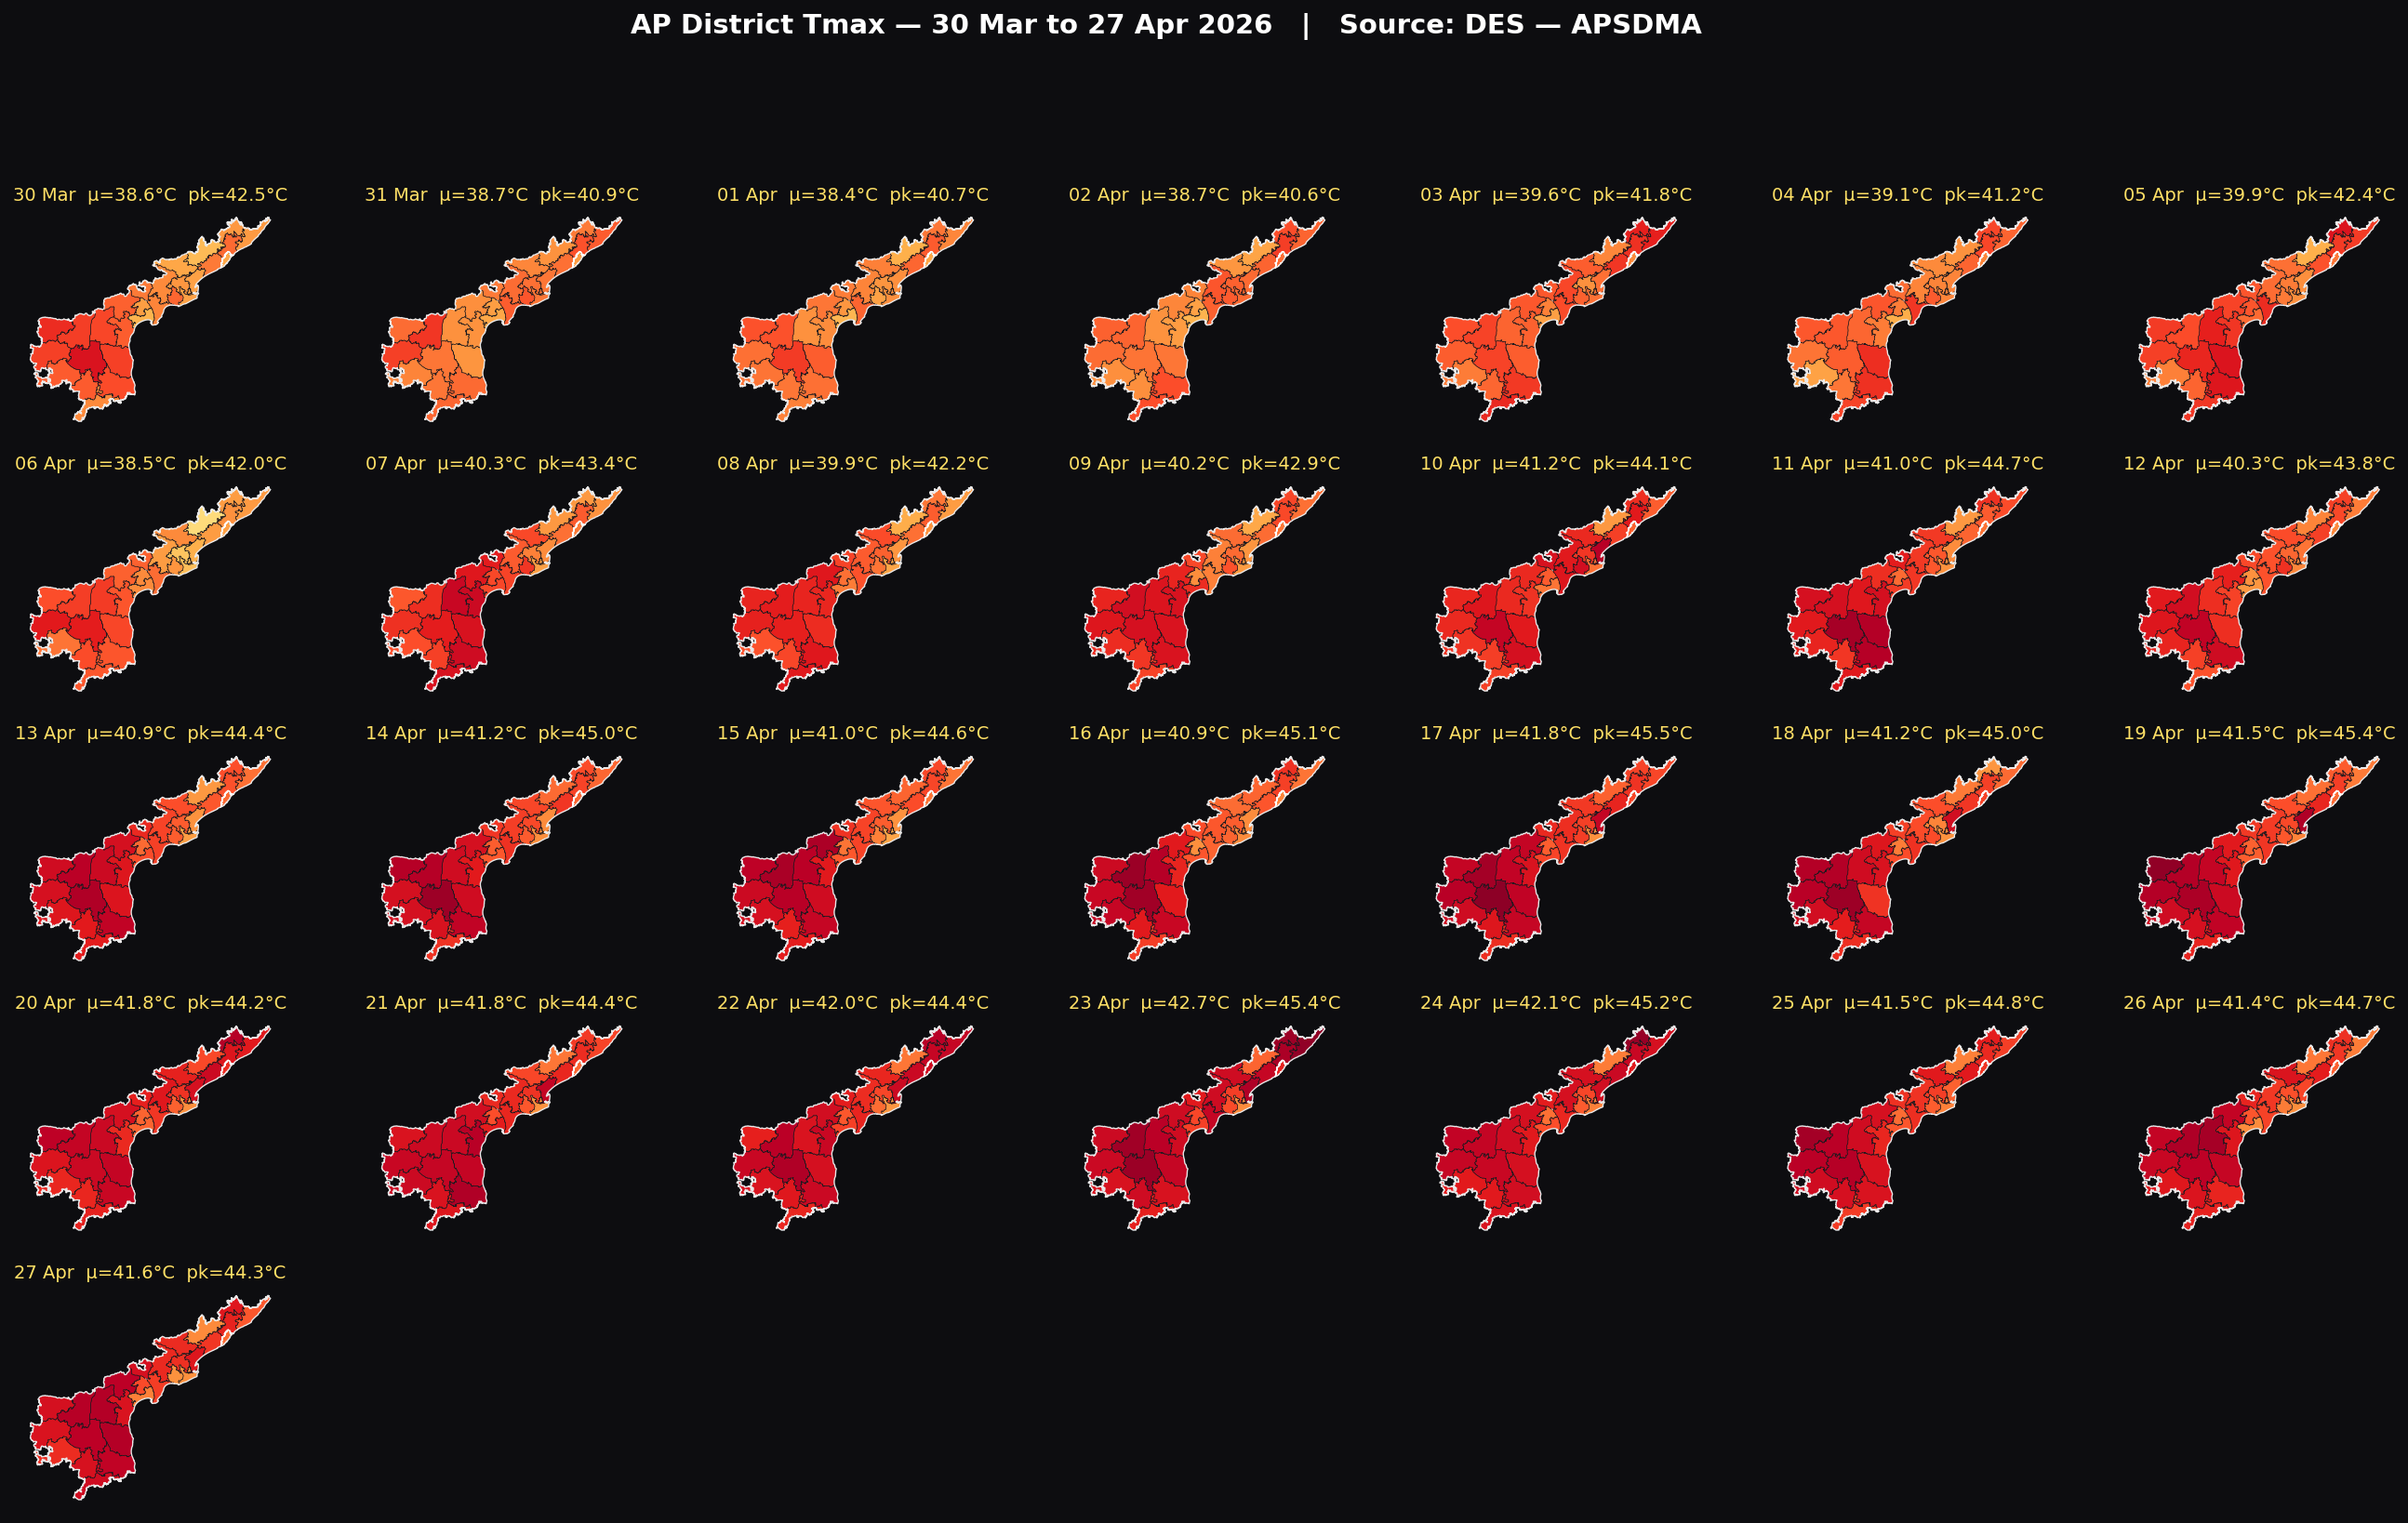
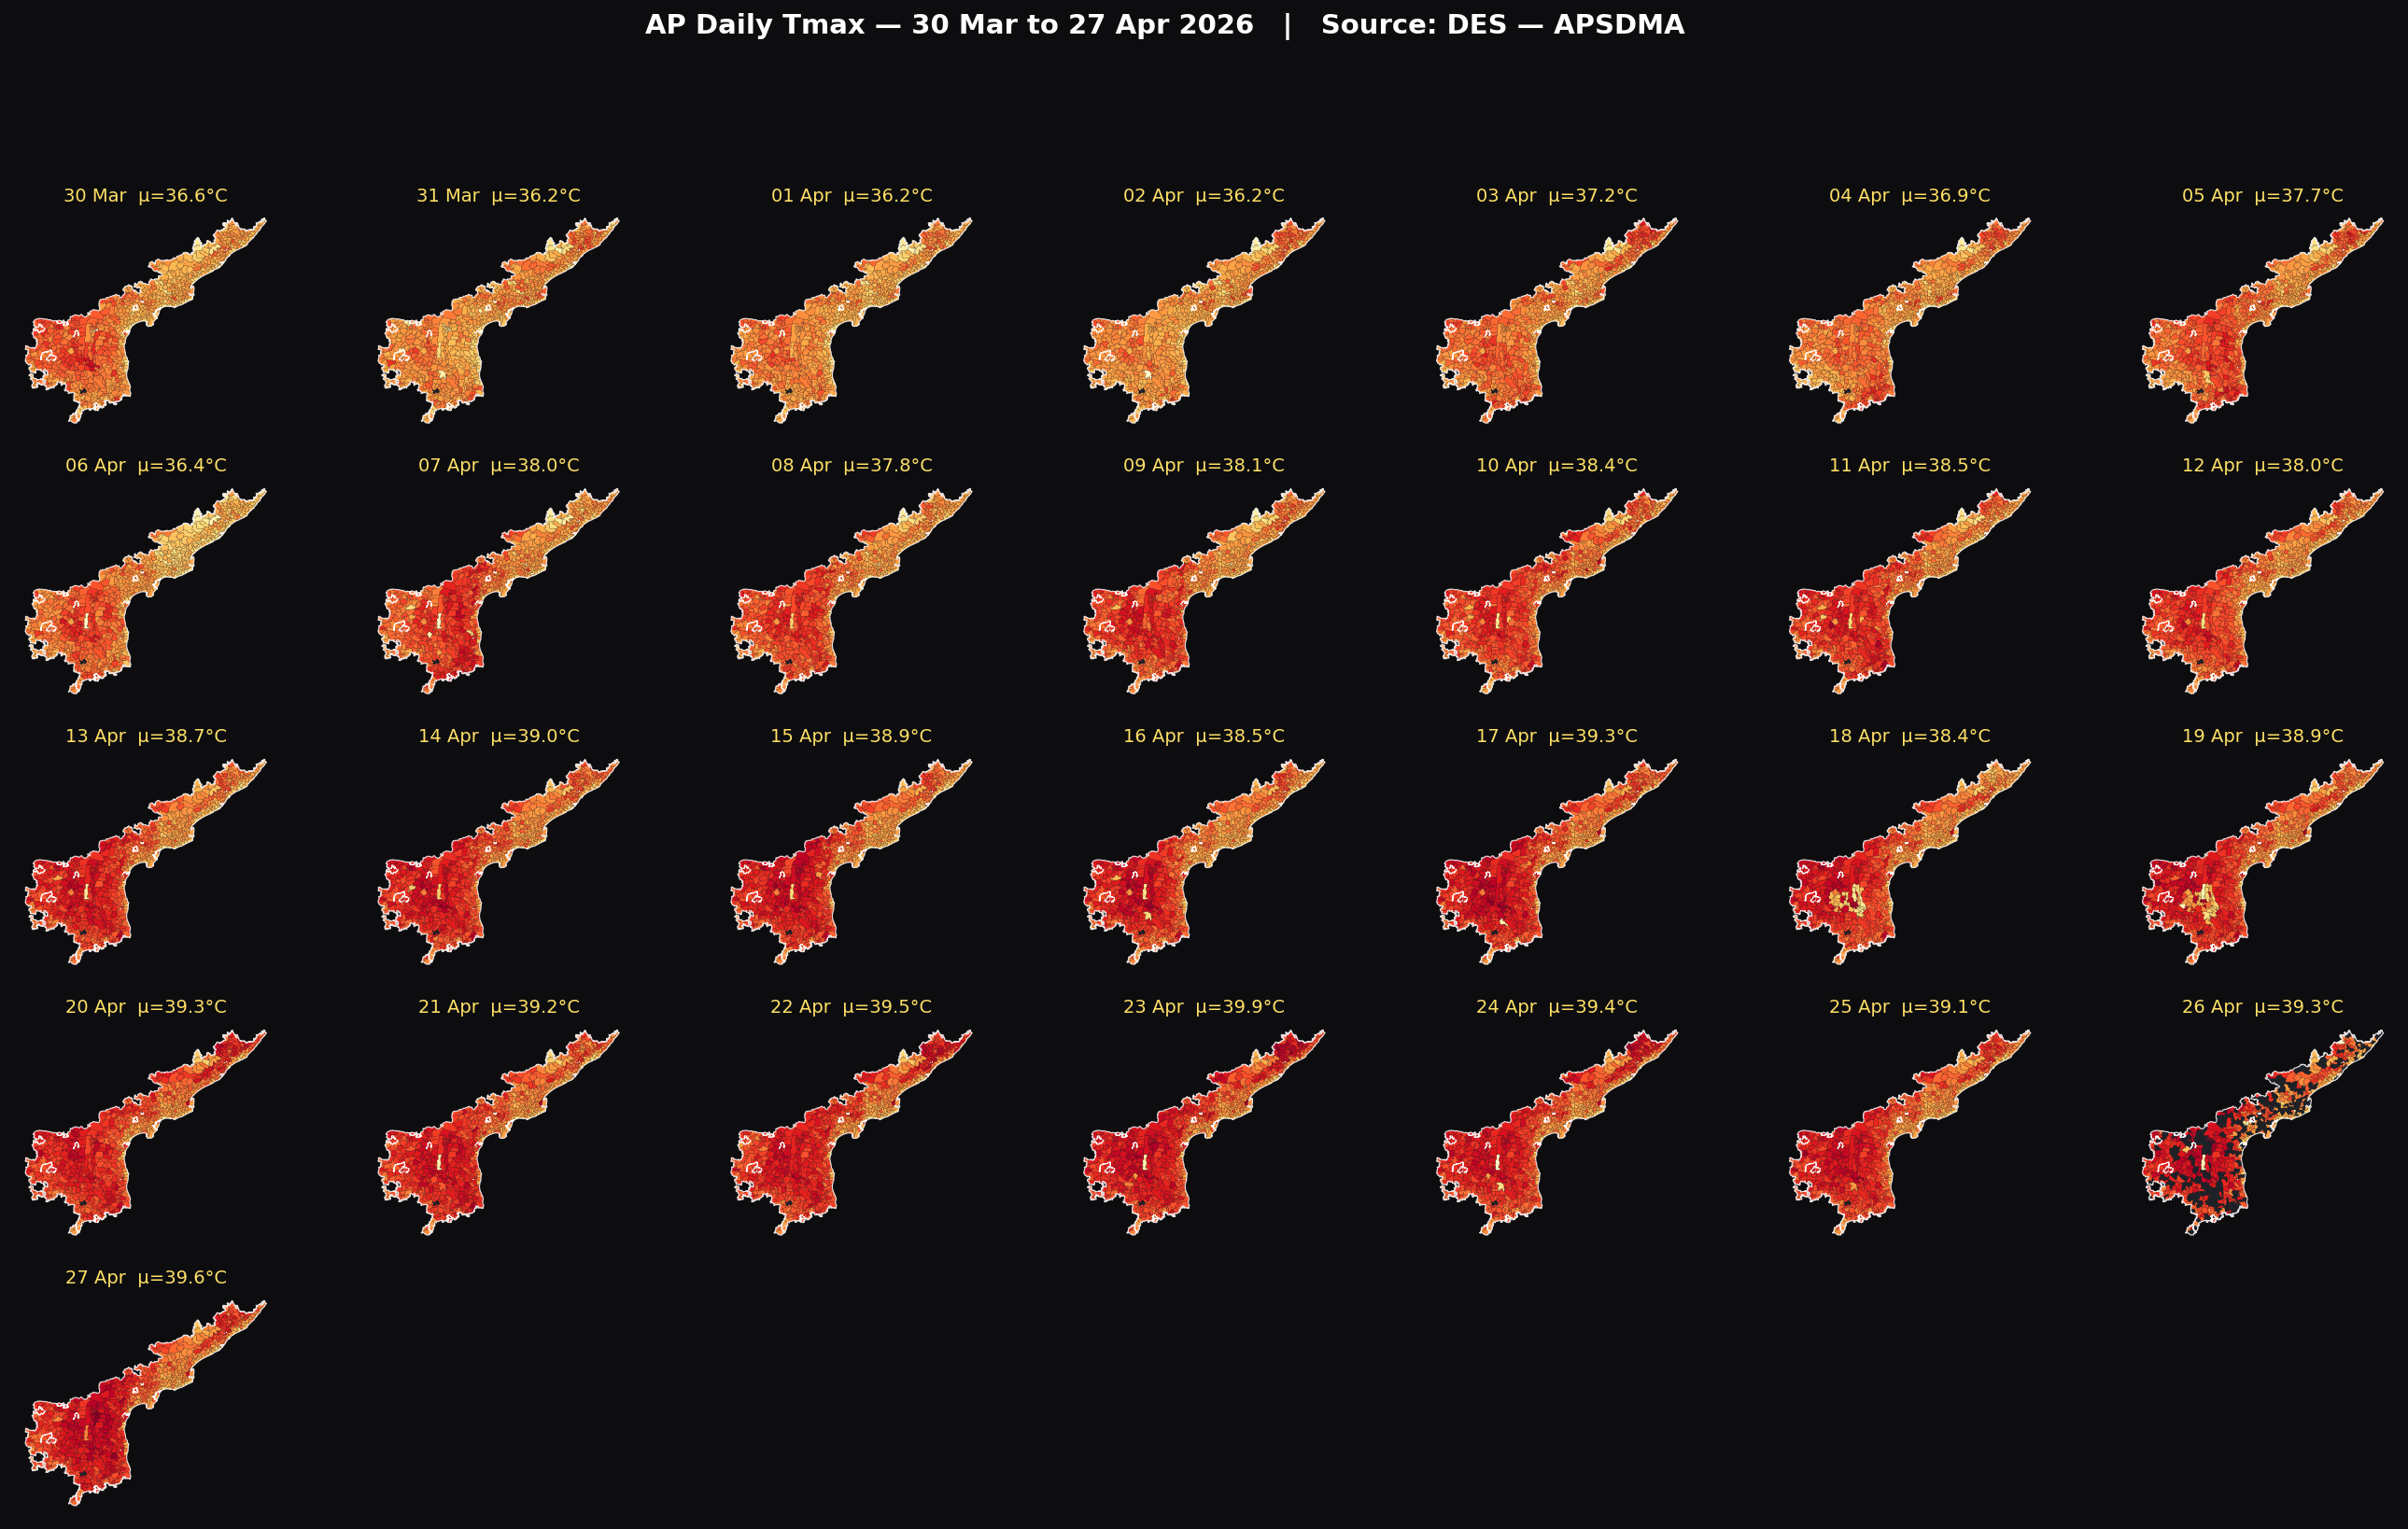
All maps use a fixed 30–46 °C colour scale so the warming trend is visually consistent across days.
District Time-lapse · 29 days · 28 districts
DES mandal AWS aggregated to district (max-of-mandal Tmax) — matches IMD heat wave declaration logic
All 29 Days — District View
Daily Peak Temperatures — DES Observations
Hottest district per day across the 29-day window, derived from DES daily MAX_AVG export and DES live AWS scrape.
| Date | State mean Tmax | State peak Tmax | Hottest district | Mandals ≥40°C | Mandals ≥44°C |
|---|---|---|---|---|---|
| 30 Mar | 38.6°C | 42.5°C | YSR Kadapa | 41 | 0 |
| 05 Apr | 39.6°C | 41.8°C | YSR Kadapa | 66 | 0 |
| 09 Apr | 39.9°C | 43.7°C | Nandyal | 159 | 0 |
| 13 Apr | 40.9°C | 44.6°C | YSR Kadapa | 237 | 2 |
| 14 Apr | 41.2°C | 44.6°C | YSR Kadapa | 262 | 5 |
| 17 Apr | 41.8°C | 45.5°C | YSR Kadapa | 300 | 9 |
| 19 Apr | 41.5°C | 45.4°C | Kurnool | 279 | 9 |
| 23 Apr | 42.7°C | 45.4°C | Srikakulam (peak) | 382 | 13 |
| 24 Apr | 42.1°C | 45.2°C | P. Manyam | 312 | 1 |
| 26 Apr | 41.4°C | 44.7°C | Nandyal | — | — |
| 27 Apr | 41.6°C | 44.3°C | YSR Kadapa | — | — |
Apr 26-27 mandal-count cells empty: DES live AWS only covers ~423 mandals on those days; full daily MAX_AVG export not yet released for those dates.
How this is built
- Pull — DES daily MAX_AVG export (688 mandals, Mar 30 – Apr 25) +
sde.des_weather_historyhourly → daily Tmax (Apr 26 – Apr 27). - Aggregate (district view) — for each district, take the maximum Tmax among its constituent mandals on that day.
- Render — 29 day key frames × 38 tween frames each = 1088 frames @ 24 fps, fixed YlOrRd colour ramp 30→46 °C.
- Encode — H.264 MP4 (libx264 quality 8), 12-fps looping GIF, plus a 7×5 static panel PNG.
- Publish — placed under
C:\inetpub\wwwroot\heatwave\media\, served via IIS at this URL.
Source script: heatwave_timelapse/build_timelapse_district.py (district) · build_timelapse.py (mandal). Re-runnable on demand or via scheduled task.