29-Day District Time-Lapse · 30 Mar – 27 Apr 2026
Source: DES — AP Mandal AWS Network
aggregated to 28 districts (max-of-mandal-Tmax per district per day) · Authentic government source · APSDMA AP TRINETRA
Peak Tmax (29-day)
45.5°C
YSR Kadapa · 17 Apr 2026
Hottest district (mean)
40.5°C
YSR Kadapa over 27 days
Peak Day (state)
23 Apr
382 mandals ≥40°C · 13 ≥44°C
State mean Tmax trend
+2.8°C
36.6°C (30 Mar) → 39.4°C (27 Apr)
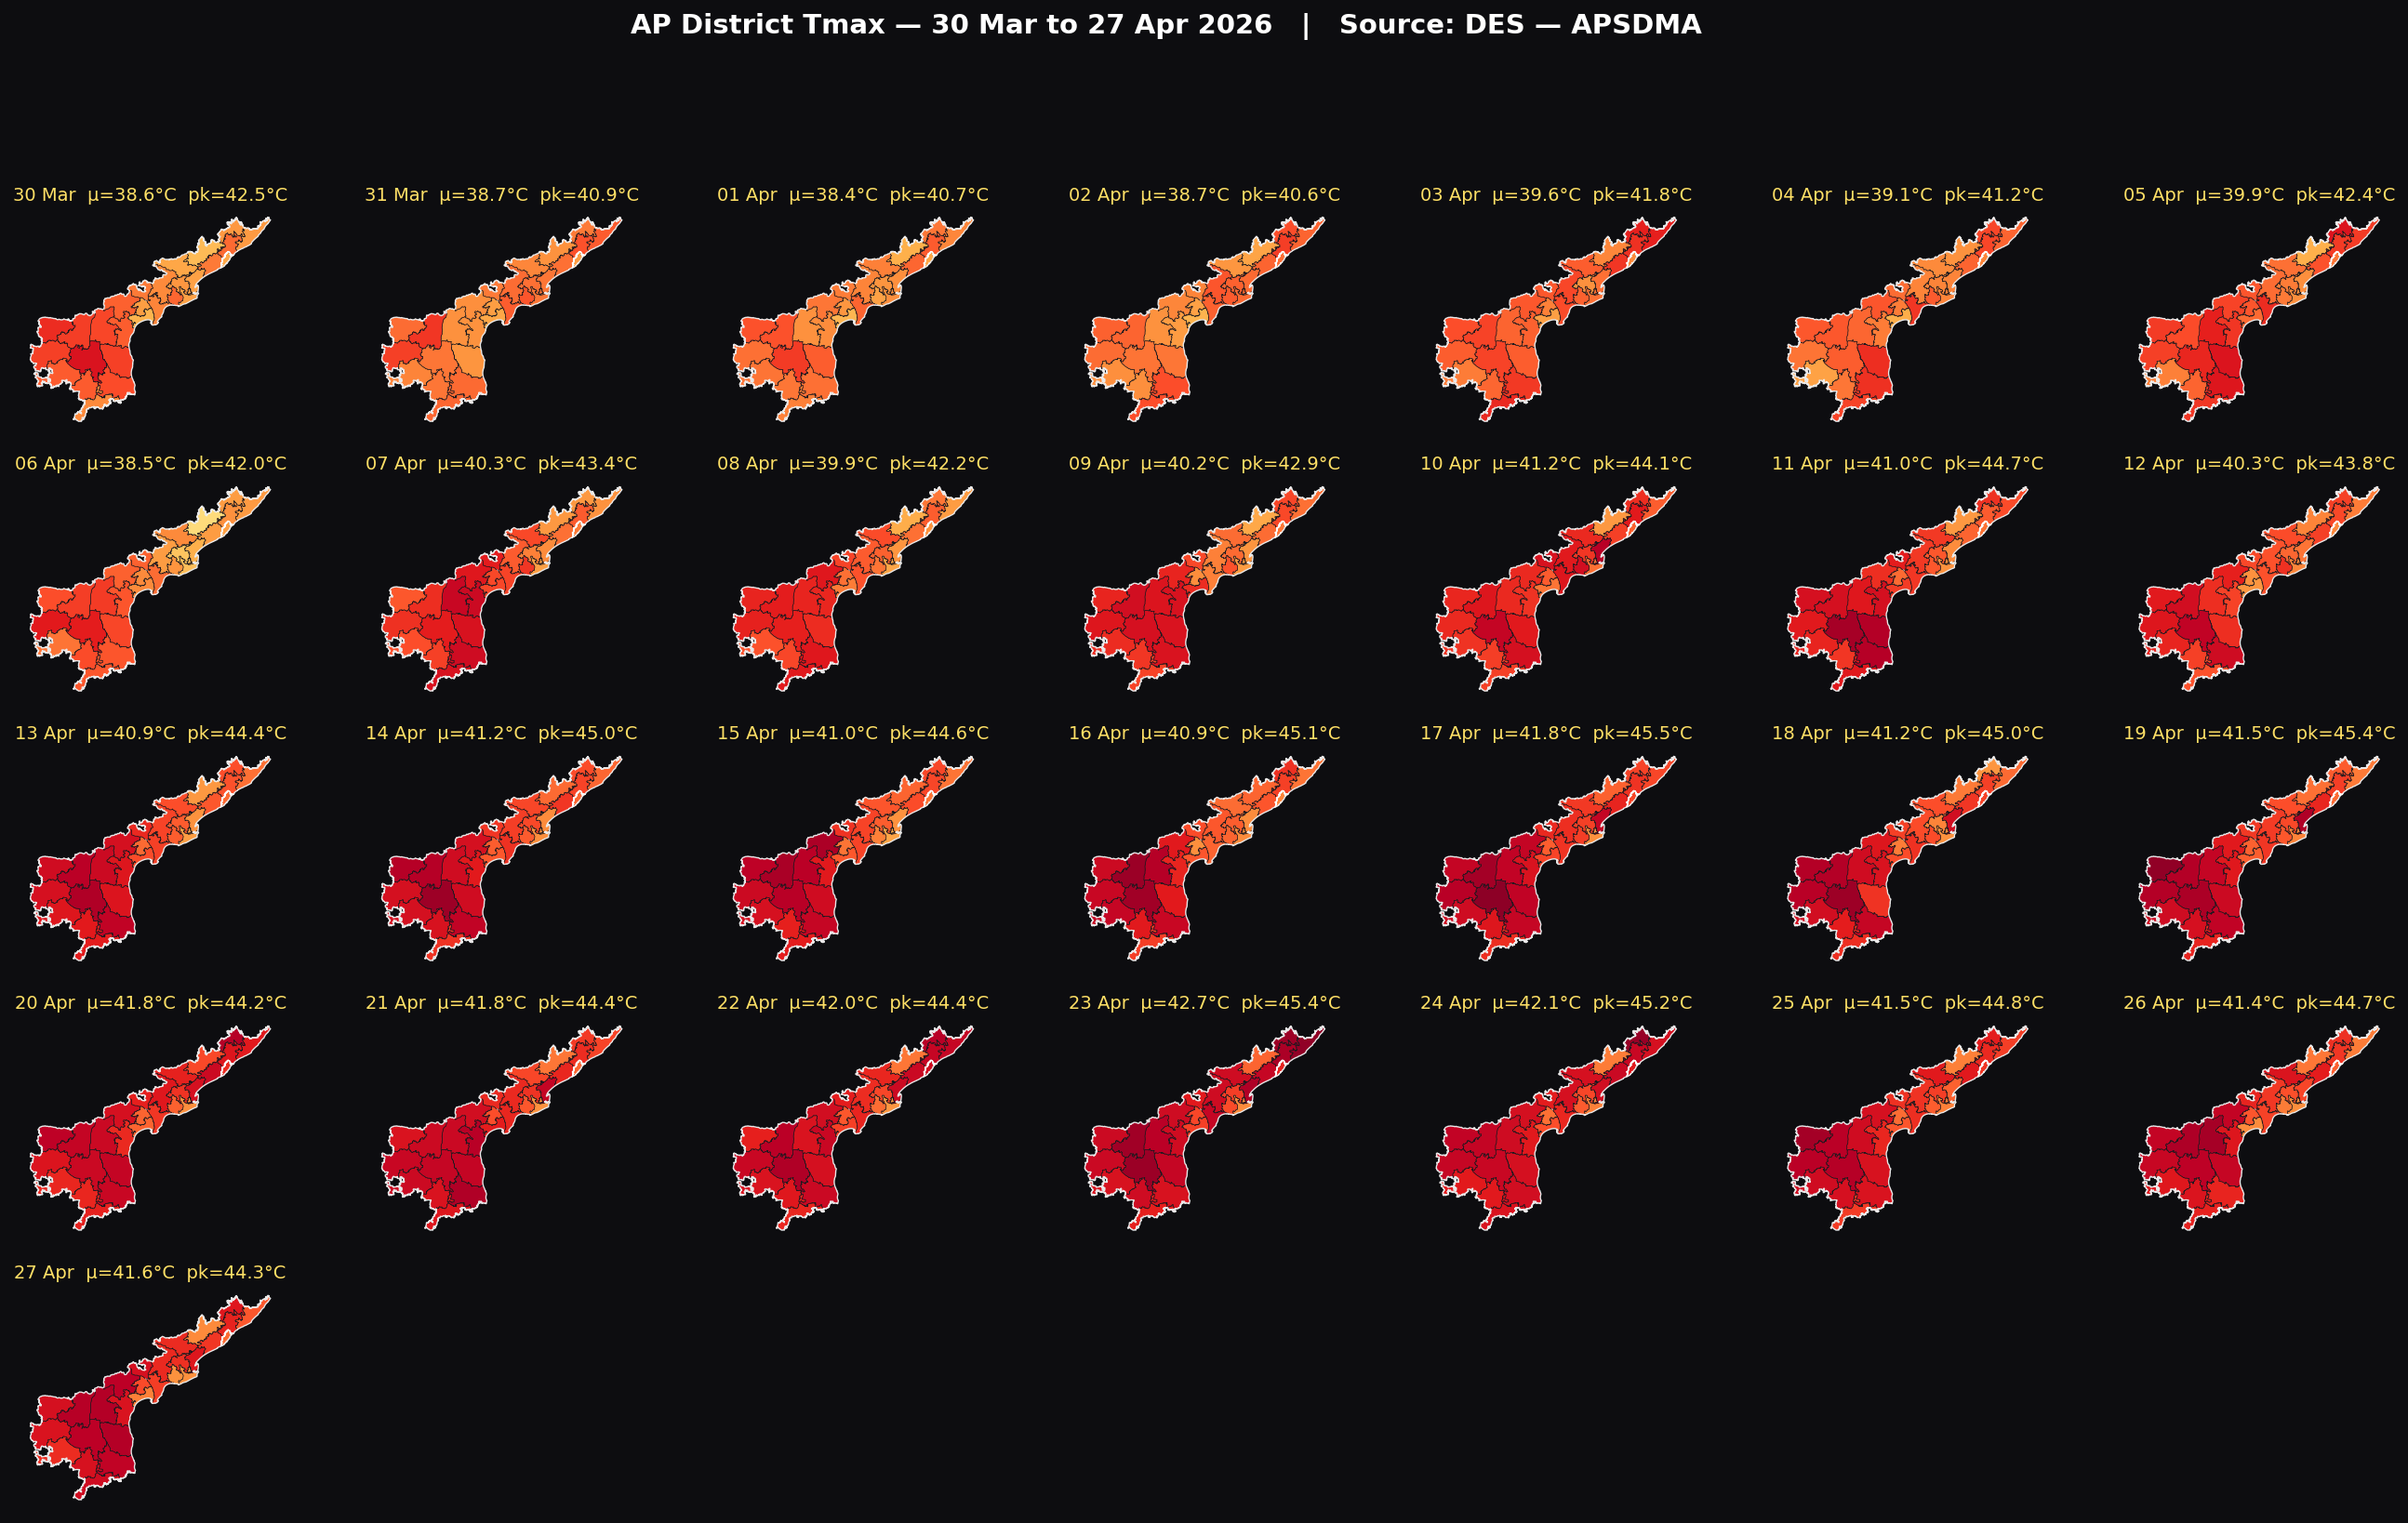
All 29 Days at a Glance — District Tmax
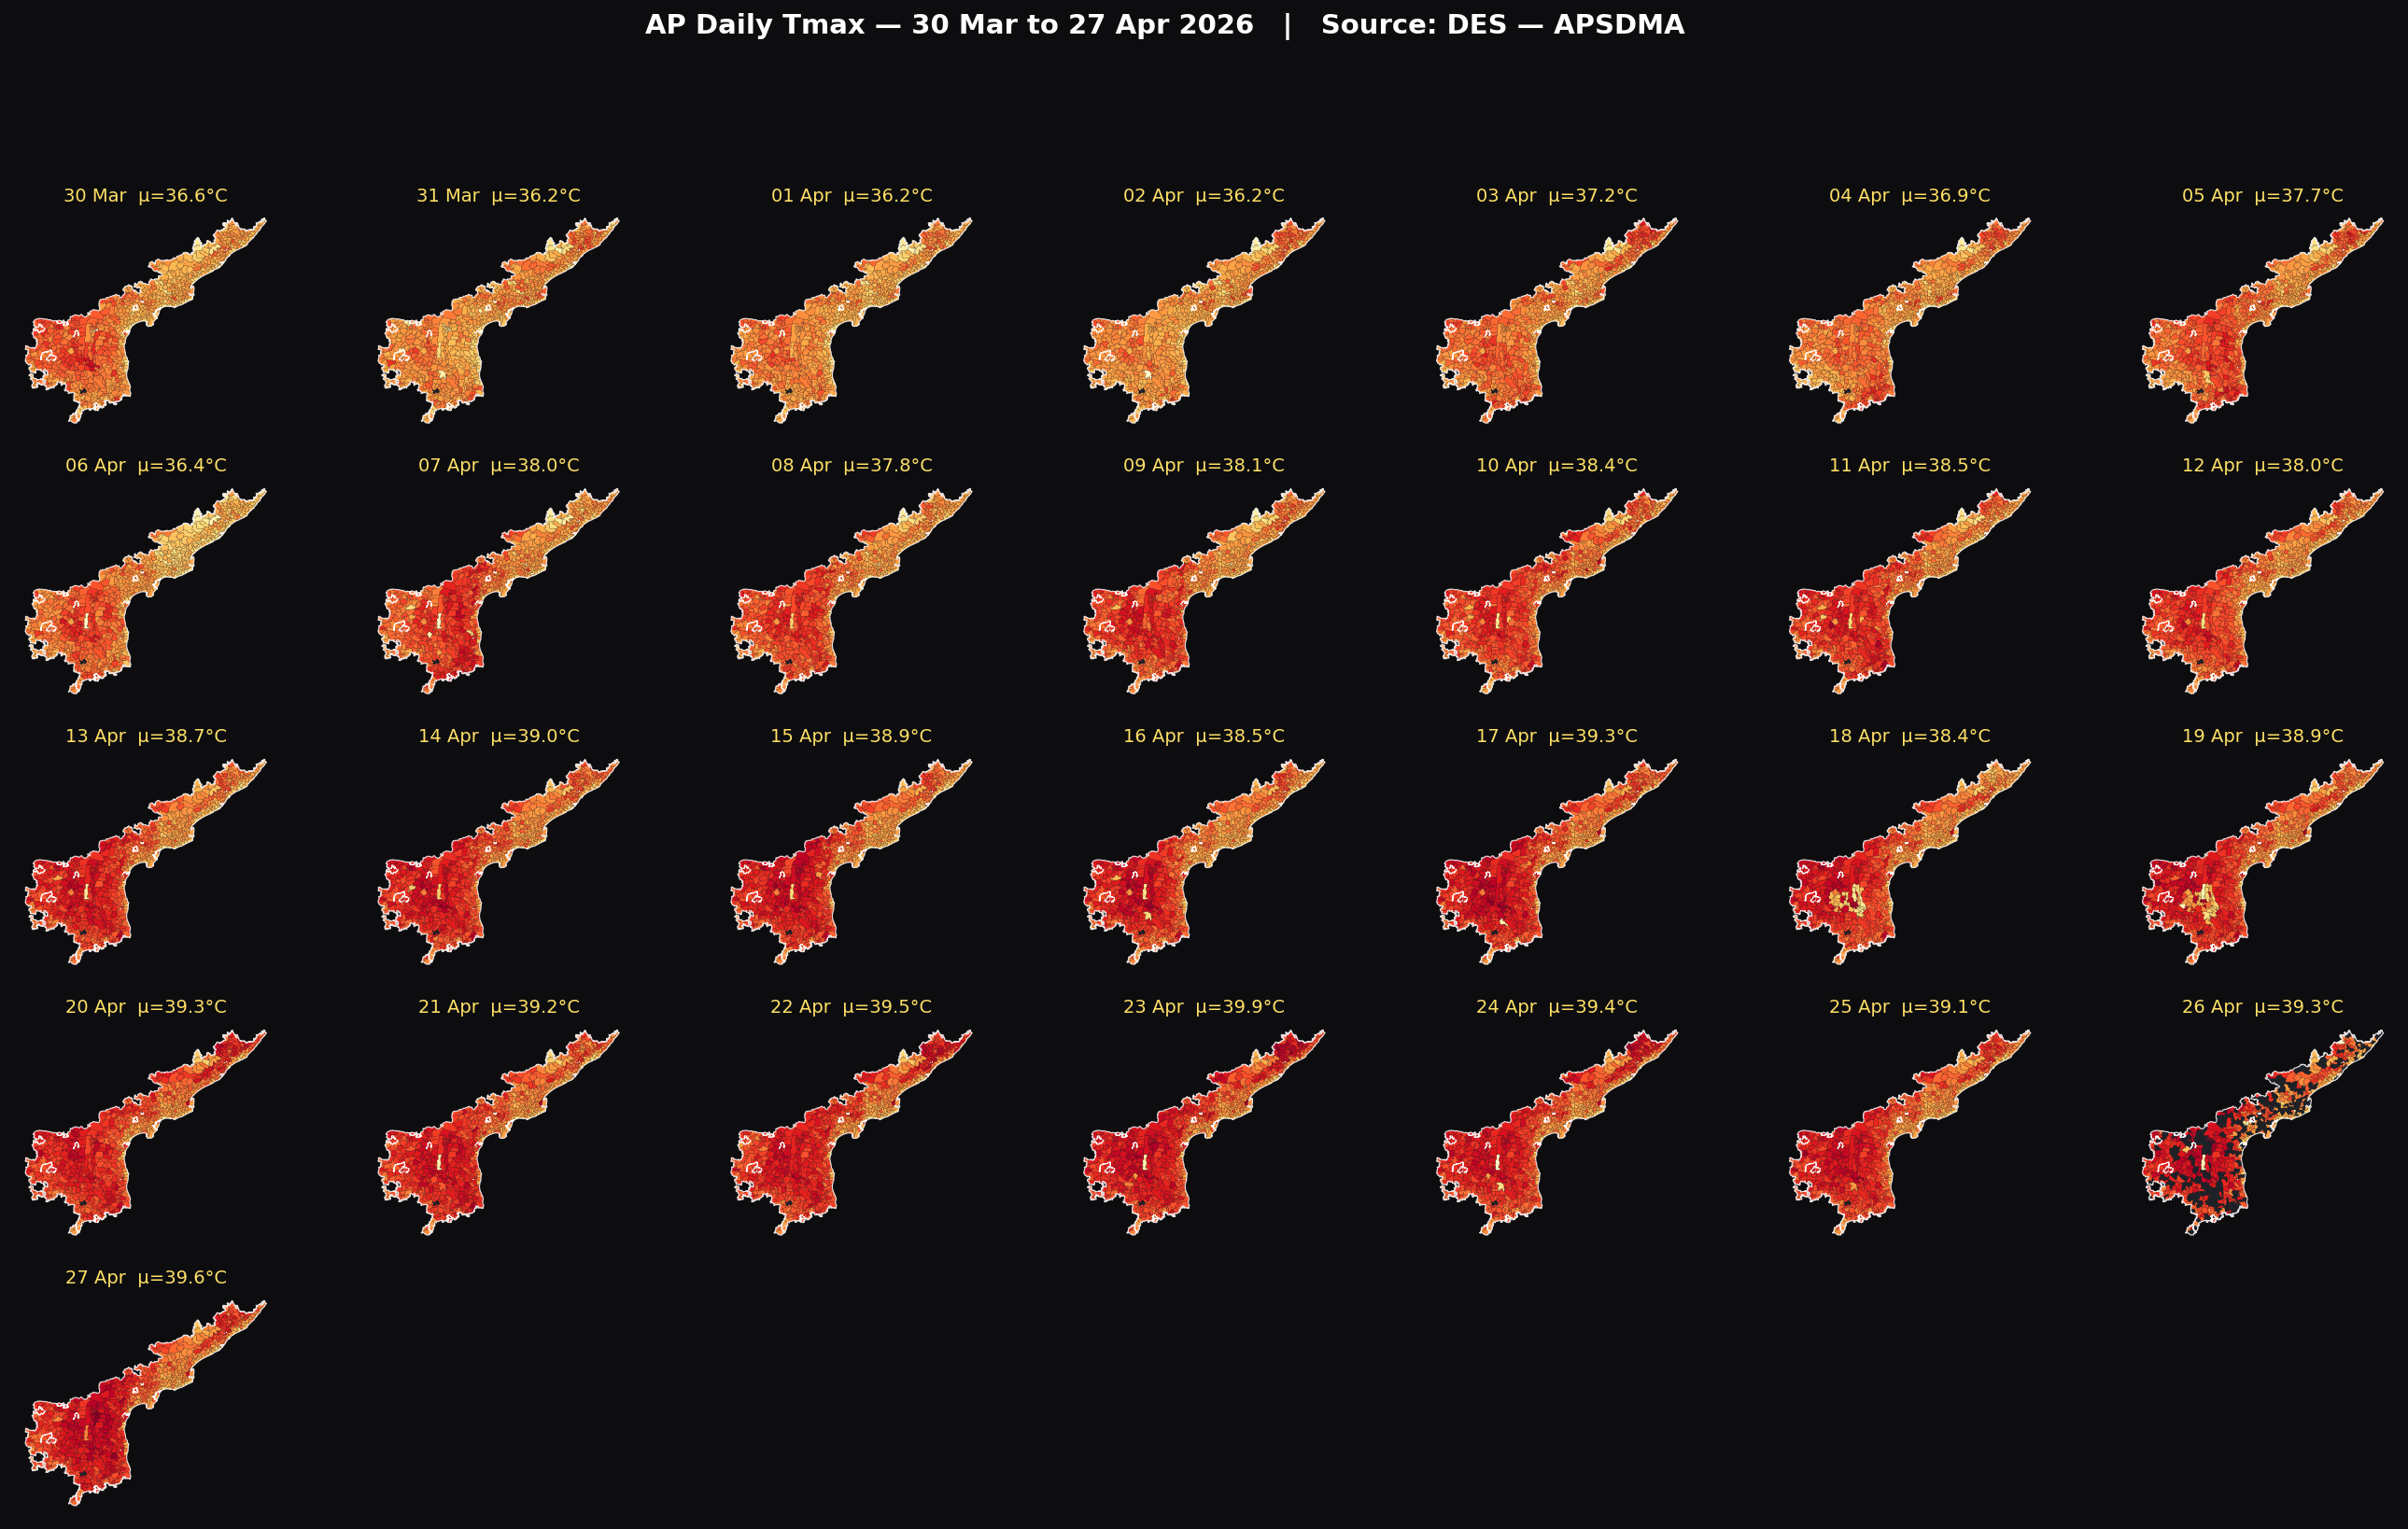
Mandal-level Detail (688 mandals)
For analyst / DEO use — granular hot-pocket detection. Some mandals show as grey where DES name does not exactly match the boundary file (≈13%).
Data Sources Powering This Page
| Source | What it provides | Coverage | Update cadence |
|---|---|---|---|
| DES | Mandal AWS Tmax / Tmin / RH / Wind | ~430-688 mandals | Hourly + daily MAX_AVG |
| IMD | NWP MME ensemble forecast (10-day) | 26 districts | Every 6 hr (SFTP) |
| IMD | GFS 0.25° GRIB (T2m, Tmax, Tmin) | State-wide raster, mandal zonal stats planned | Daily 00Z |
| IMD | Heat wave color-coded warnings (planned) | District-level | Twice daily nowcast |
| NRSC | Land Surface Temperature (LST) — planned | State-wide raster | Per satellite pass |
Note: Third-party APIs (OpenWeather, Open-Meteo) are not used as primary sources for heat wave products. All headline values trace to IMD or DES.
How the time-lapse is built
- Step 1 — Pull: DES daily MAX_AVG export (Mar 30 – Apr 25) + DES hourly weather → daily Tmax (Apr 26 – Apr 27).
- Step 2 — Aggregate: For each district, take the maximum of constituent mandal Tmax — matches IMD heat wave declaration logic.
- Step 3 — Render: 29 day frames × 38 tween frames each, fixed YlOrRd colour scale 30→46 °C so warming is visually obvious.
- Step 4 — Encode: H.264 MP4 (24 fps), looping GIF (12 fps), and a 7×5 static panel PNG.
- Step 5 — Publish: deployed to
https://apsdmagis.ap.gov.in/heatwave/(this page).